Set Analysis lets you ask questions your standard filters can’t. “What were sales last year for customers who are still active this year?” That’s a one-line expression. Without Set Analysis, it’s a data model workaround that usually breaks. Set Analysis is the difference between a dashboard that answers real business questions and one that just shows filtered totals. This guide covers the complete syntax, the key operators, and practical examples you can use immediately.
What Is Set Analysis in Qlik Sense?
Set Analysis is a method for defining a custom data set within aggregation functions, instead of using the current user selection. It lets you precisely control which records are included in a calculation.
A classic example: You want to display the current year’s revenue next to last year’s revenue, regardless of which year filters the user has applied. This is not possible with normal aggregations. Set Analysis makes exactly this possible, directly in the chart expression.
If you are already familiar with Qlik Sense Expressions, you know that aggregation functions like Sum(), Count(), or Avg() always operate on the currently filtered data set. Set Analysis extends these functions with an optional “set expression” that defines the data set independently of the user selection.
The reason Set Analysis matters beyond syntax is that most finance and operations questions require comparing across time periods, customer segments, or product groups while holding other dimensions fixed. A controller asking “what was our gross margin in Q3 for products launched this year” needs Set Analysis. Without it, the dashboard gives a number that looks right but isn’t.
This shows up constantly in practice. Year-over-year variance. Retention by cohort. Revenue from active customers only. These aren’t edge cases. They’re the questions finance asks every month. Set Analysis is how you answer them without rebuilding the data model.
Set Analysis is not an optional add-on. It is a core competency for anyone developing productively with Qlik Sense.
What is the basic syntax of Set Analysis?
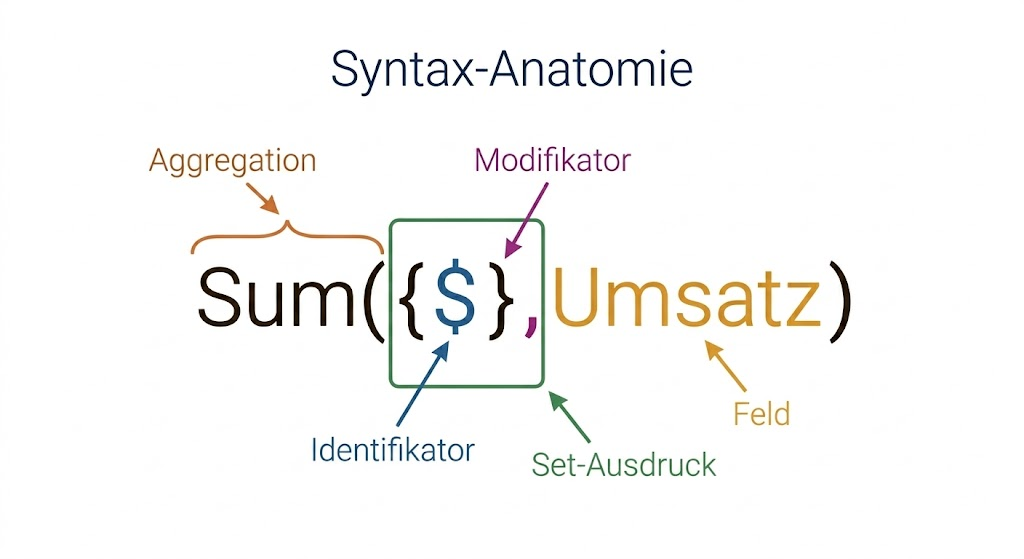
Set Analysis lives inside aggregation functions. Always. The set expression goes in curly braces between the function name and the field. Four parts: the aggregation, the identifier, the modifier, and the field. For the complete syntax specification, see the set analysis syntax reference.
The basic structure:
Sum( {Set expression} FieldName )
//         ↑
//  Identifier + optional modifiers
A concrete example that only sums revenue for the year 2024:
Sum({$ <Year = {'2024'}>} Sales)The individual parts at a glance:
- Curly braces
{}: Delimit the entire set expression - Set Identifier (
$,1, or Bookmark ID): Defines the base data set - Angle brackets
<>: Contain the set modifiers - Set Modifier (
Field = {'Value'}): Filters or extends the data set
How do you set identifiers like $, 1, and bookmarks?
The set identifier determines which data set serves as the starting point. There are three types. For in-depth documentation, see the Qlik official set analysis documentation.
How to Use the $ Symbol in Qlik Sense?
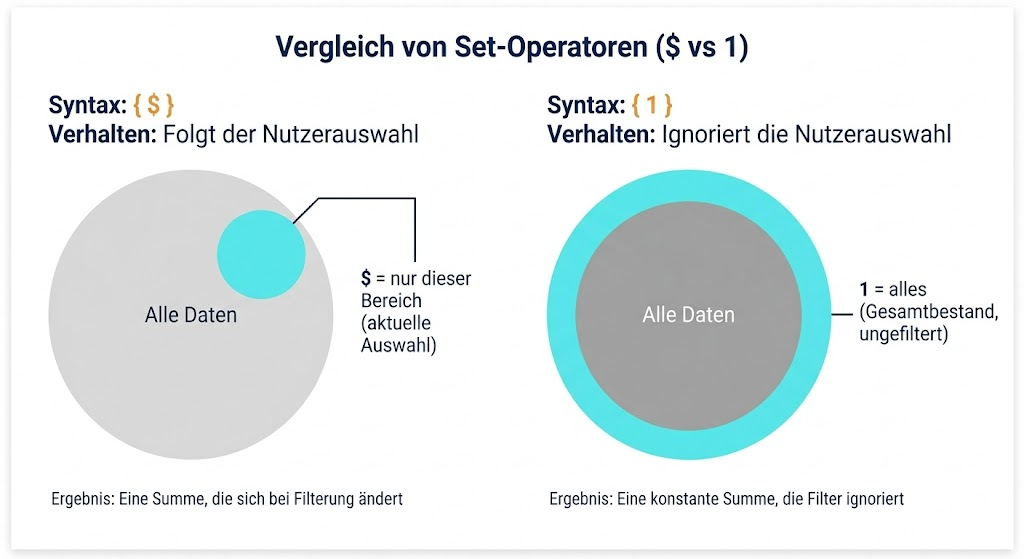
$ represents the user’s current selection state. This is the default value when no identifier is specified.
// These two expressions are identical:
Sum({$} Sales)
Sum(Sales)
$ becomes interesting only with modifiers, for example to exclude a single dimension from the current selection:
// Ignores the Year selection, keeps all other filters
Sum({$ <Year=>} Sales)
How do I select all records in Qlik Sense?
1 (the number one) represents the complete data set without any selection.
// Always returns total revenue, regardless of user filters
Sum({1} Sales)
This is useful for share calculations: Sum(Sales) / Sum({1} Sales) always returns the share of total revenue, even when the user has applied filters.
How do Bookmark IDs work in Qlik Sense?
You can use a bookmark name as an identifier to incorporate predefined scenarios into calculations:
Sum({BM01} Sales)This is practical for standardized comparison scenarios that all users should apply consistently.
How to Control Field Values with Set Operators?
The set operators determine how the specified field values are applied to the base data set.
| Operator | Meaning | Example |
|---|---|---|
= |
Replace the selection with this value | <Year = {'2024'}> |
+= |
Add this value to the selection (Union) | <Region += {'North'}> |
-= |
Remove this value from the selection | <Category -= {'Other'}> |
*= |
Intersect with the selection | <Country *= {'US', 'UK'}> |
/= |
Symmetric difference | <Status /= {'Active'}> |
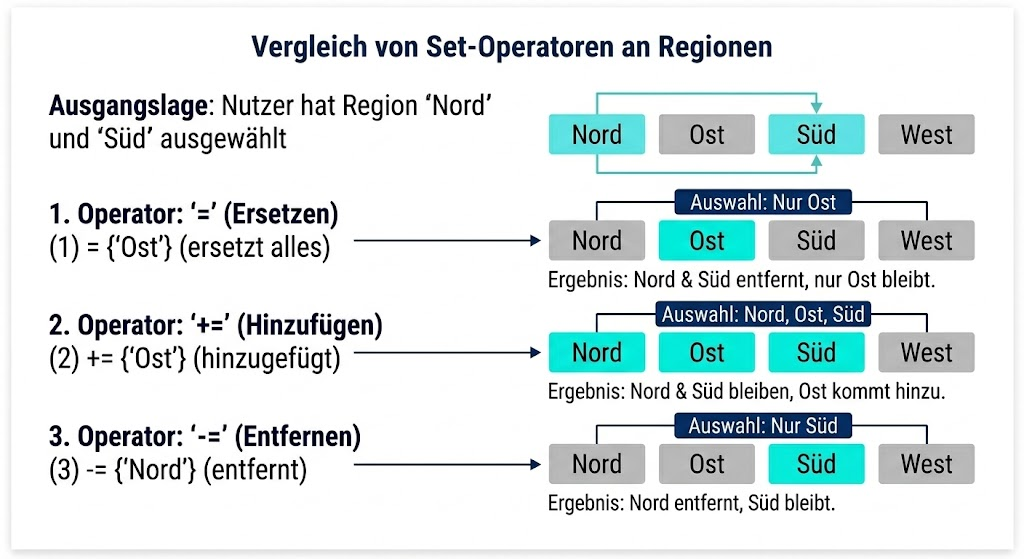
The = operator is by far the most common. The other operators come into play when you want to extend or narrow the existing user selection rather than replacing it entirely.
What are practical set analysis examples?
Here are the expressions you will need most frequently in day-to-day development.
How to Calculate Year-to-Date (YTD) Revenue?
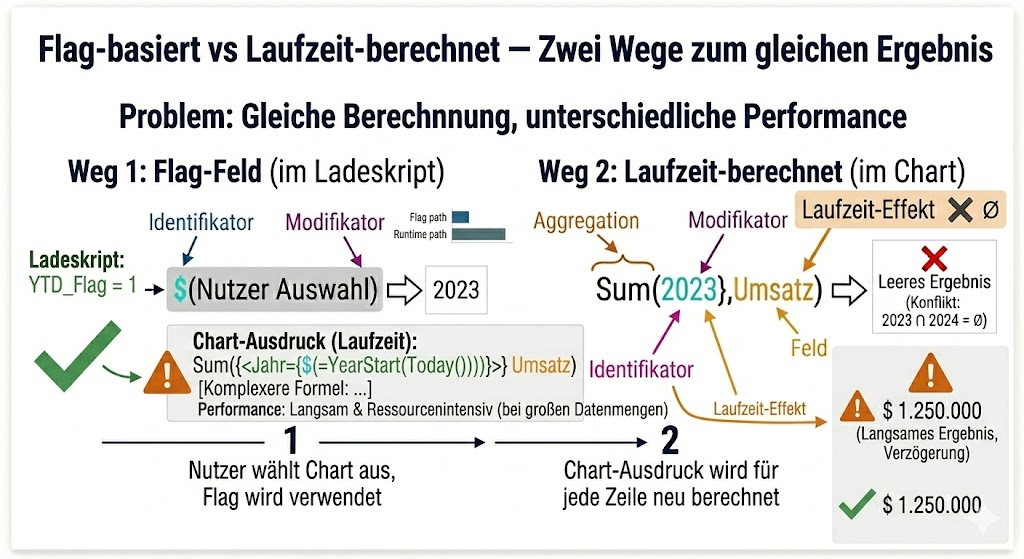
YTD calculates the cumulative revenue from the beginning of the year to today. The most elegant approach uses a YTD flag from the Master Calendar:
// In the load script: Set the YTD flag
If(Date <= Today() AND Year(Date) = Year(Today()), 1, 0) AS YTD_Flag

// In the chart: Use the flag
Sum({$ <YTD_Flag = {1}>} Sales)
Alternatively, without a flag field (slightly more complex):
Sum({$ <Date = {">=$(=YearStart(Today()))<=$(=Today())"}>} Sales)For more on Flag-Based Modeling in Qlik Sense – setting flags in the load script instead of calculating at runtime – see the dedicated article.
How to compare data to the same period last year?
The prior year comparison is one of the most common use cases in reporting projects. With Dollar-Sign Expansion, it becomes dynamic:
// Current year (dynamic)
Sum({$ <Year = {$(=Year(Today()))}>} Sales)

// Prior year (dynamic)
Sum({$ <Year = {$(=Year(Today())-1)}>} Sales)

// Same Period Last Year (SPLY): Prior year, same month
Sum({$ <Year = {$(=Year(Today())-1)}, Month = {$(=Month(Today()))}>} Sales)
Note: $(=Year(Today())-1) is Dollar-Sign Expansion, which calculates the value before the set expression is evaluated. More on this in its own section below.
How to Include Top N Customers in Qlik Sense?
With the Aggr() function in the set modifier, you can include only the highest-revenue customers in a calculation:
// Revenue from only the top 10 customers by total revenue
Sum({$ <CustomerID = {"=Aggr(Rank(Sum({1} Sales), 4, 1), CustomerID) <= 10"}>} Sales)
How to exclude specific values in Qlik Sense?
With the -= operator, you can remove values from the existing selection without having to explicitly name them:
// Revenue without returns
Sum({$ <TransactionType -= {'Return'}>} Amount)

// Revenue without test and internal orders
Sum({$ <CustomerType -= {'Test', 'Internal'}>} Sales)
How do you combine multiple sets in Qlik Sense?
You can combine sets with + (Union) and * (Intersection):
// Union: Revenue from the US OR UK (user selection ignored)
Sum({1 <Country = {'US'}>} + {1 <Country = {'UK'}>} Sales)

// Intersection: Current selection AND only year 2024
Sum({$} * {1 <Year = {'2024'}>} Sales)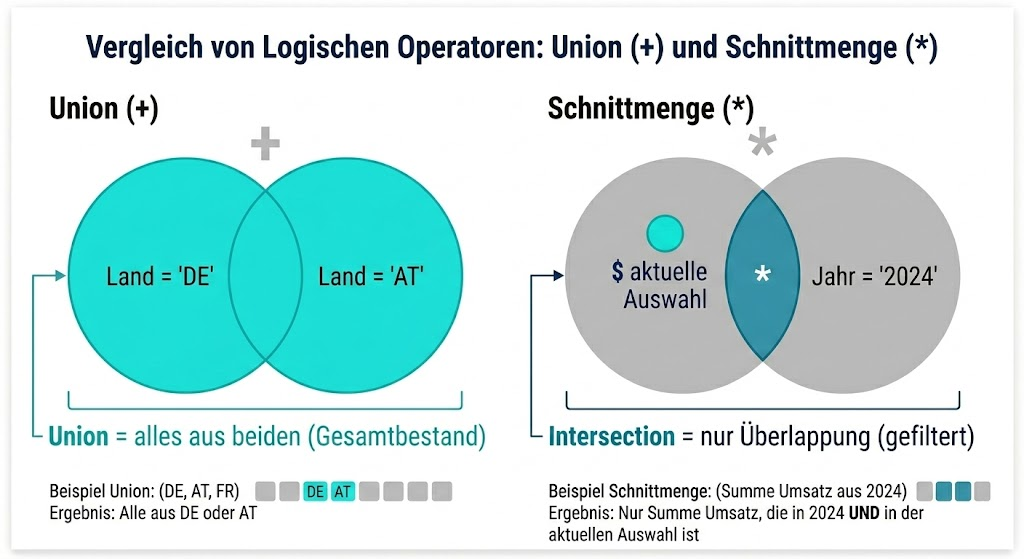
What are the P() and E() functions in Qlik Sense?
The functions P() (Possible Values) and E() (Excluded Values) return the possible or excluded field values of another set, respectively.
- P(Set, Field): All values of Field that are possible in the specified set
- E(Set, Field): All values of Field that are excluded in the specified set
Example: Revenue from all customers who have purchased at least one premium product, based on the current selection:
Sum({$ <CustomerID = P({1 <ProductCategory = {'Premium'}>} CustomerID)>} Sales)And the opposite case with E() – all customers who have NOT purchased a premium product:
Sum({$ <CustomerID = E({1 <ProductCategory = {'Premium'}>} CustomerID)>} Sales){VISUAL: P() and E() — Two table columns: left “Customers” (A, B, C, D, E), right “Product Category” (Premium/Standard). P() highlighted: Customers A, C, E who bought Premium → marked green. E() highlighted: Customers B, D who have NO Premium → marked orange. Shows visually “who is in, who is out”}
Official documentation for these functions can be found in the Qlik Sense Set Analysis Syntax Reference.
How to Use Dollar-Sign Expansion in Set Analysis?
Dollar-Sign Expansion ($(=Expression)) embeds dynamic values into the set expression. The expansion is evaluated before the set expression is interpreted.
// Current quarter dynamically
Sum({1 <Quarter = {$(=Num(Ceil(Month(Today())/3)))}, Year = {$(=Year(Today()))}>} Sales)

// Flexible comparison: Prior year based on user selection
Sum({1 <Year = {$(=Only(Year) - 1)}>} Sales)
The second expression is particularly useful: When the user selects Year 2024, $(=Only(Year) - 1) calculates the value 2023, and the set expression is evaluated as <Year = {2023}>.
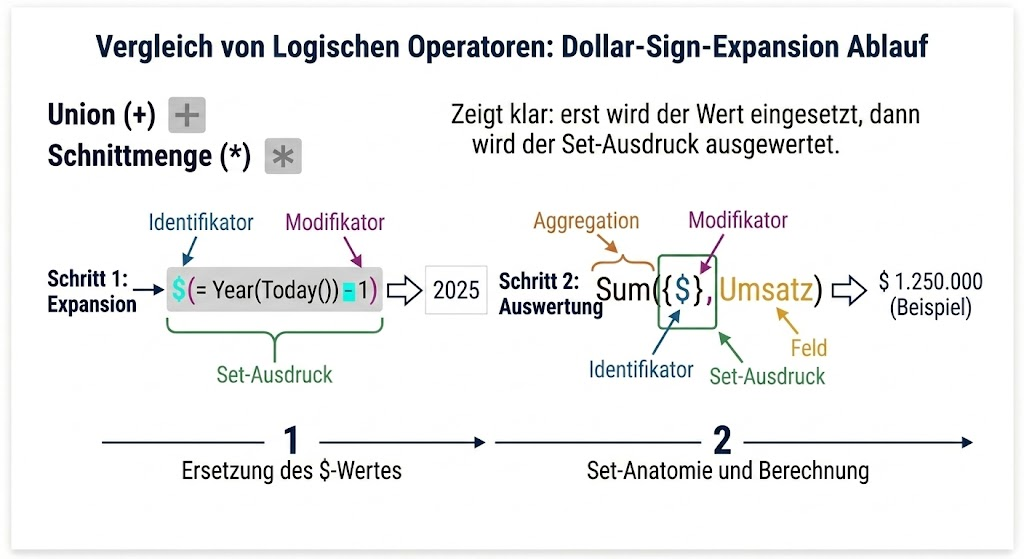
Important for debugging: Use a text object with the expression $(=Only(Year) - 1) to see what value the expansion currently calculates, before embedding it into the set expression.
How to combine Set Analysis with Aggr() in Qlik Sense?
The combination of Set Analysis and Aggr() is particularly powerful for rankings and conditional calculations. Aggr() computes a virtual table that you can then use within Set Analysis.
// Average revenue only for customers above the overall average
Avg({$ <CustomerID = {"=Sum({1} Sales) > Avg(Aggr(Sum({1} Sales), CustomerID))"}>} Sales)

// Share of top 20% customers in total revenue
Sum({$ <CustomerID = {"=Aggr(Rank(Sum({1} Sales), 4, 1), CustomerID) <= $(=Ceil(Count(Distinct CustomerID)*0.2))"}>} Sales)
/ Sum({1} Sales)
This kind of metric is most commonly used in KPI Objects in Qlik Sense, where you want to present complex conditional calculations in a single visualization.
What are common mistakes in Qlik Sense Set Analysis and how to avoid them?
Set Analysis has some pitfalls. These are the most frequent errors and how to fix them.
How to Fix Wrong Quotation Marks in Qlik Sense Set Analysis?
Field values in set modifiers are specified in single quotes inside curly braces. String comparisons without quotes do not work:
// Correct:
Sum({$ <Status = {'Active'}>} Amount)

// Wrong (does not work for string values):
Sum({$ <Status = {Active}>} Amount)

// Numeric values without quotes:
Sum({$ <Year = {2024}>} Amount)
How to resolve identifier and user selection conflicts?
When you use $ as the identifier and the user has already selected the same field value that you want to override with a modifier, this can lead to empty results:
// Problem: User has selected Year 2023. This expression returns nothing,
// because $ contains the 2023 selection and 2024 is not possible within it:
Sum({$ <Year = {2024}>} Sales)

// Solution: Use the full data set as the base:
Sum({1 <Year = {2024}>} Sales)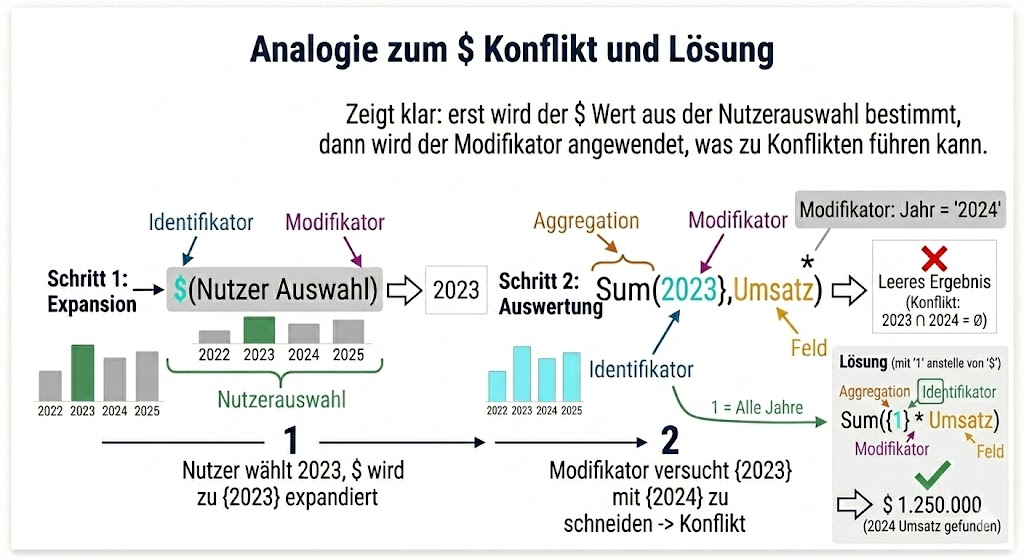
How to fix forgotten quotes for numeric year values in Qlik Sense?
In Qlik Sense, year numbers are often stored as numeric values. Here you need to work without quotes or verify the correct representation:
// When Year is stored as a number:
Sum({$ <Year = {2024}>} Sales)

// When Year is stored as a string:
Sum({$ <Year = {'2024'}>} Sales)
Syntax errors in Set Analysis often manifest as empty visualizations without an error message. This type of diagnostic issue is covered in detail in the article on data model problems and Synthetic Keys in Qlik Sense.
What are the performance considerations for Set Analysis?
Set Analysis is fast by default. The decisions that slow it down are predictable and avoidable. With large data models containing millions of records, these rules are the difference between a chart that renders in milliseconds and one that times out.
Rules for good performance:
- Prefer flag fields: Calculate complex conditions in the load script and use the flag field in Set Analysis. This is almost always faster than dynamic expressions at runtime.
- Avoid nested P() functions: Each nesting level significantly increases calculation overhead.
- Use Aggr() in sets sparingly:
Aggr()in the set modifier computes a virtual table for each value. This can become very slow with many dimensions. - Identifier
1instead of$: When you are ignoring the user selection anyway, use1as the base – it saves one evaluation step.
A well-structured star schema data model is the prerequisite for performant Set Analysis. If you still need to optimize your data model, you will find everything essential in the Qlik Sense Data Modeling Course. All further performance techniques for charts and expressions can be found in the article on performance optimization in Qlik Sense.
What is Set Analysis in Qlik Sense?
What Is the Difference Between Set Analysis and a WHERE Clause in the Load Script?
A WHERE clause in the load script permanently filters data out of the data model during loading. Set Analysis, on the other hand, filters dynamically at calculation time and leaves the data in the data model untouched. With Set Analysis, you can calculate multiple different data sets simultaneously in a single visualization – for example, current year and prior year side by side. This is not possible with a WHERE clause.
Can I Combine Set Analysis with the Master Calendar?
Yes, Set Analysis and the Master Calendar complement each other perfectly. Time-based calculations like YTD, SPLY, or rolling 12 months are significantly easier and more performant to implement with a Master Calendar than with purely dynamic set expressions. You simply reference the date fields or flag fields from the Master Calendar in your set modifiers.
Dynamic bookmarks use set analysis expressions under the hood — see how to create dynamic selections with bookmarks that automatically select the latest date period.
What Happens If I Don’t Specify an Identifier in Set Analysis?
Without an explicit identifier, Qlik Sense automatically uses $, meaning the current user selection as the base data set. In most cases, this is the desired behavior. However, it can lead to unexpected results when the user selects fields that you intended to override with a modifier, since $ then contains the original selection.
How Do I Debug a Set Analysis Expression That Returns Nothing?
The best approach is step-by-step decomposition. Start with the simplest expression (Sum({1} Amount)) and add modifiers one at a time. Check that the field values in the set expression are spelled exactly as they are in the data model, including capitalization. Use a text object with the Dollar-Sign Expansion expression (=$(=Only(Year) - 1)) to see the currently calculated value before embedding it in the set expression.
When Should I Use Set Analysis Instead of If() in Aggregation Functions?
Set Analysis is almost always the better choice over Sum(If(Condition, Value)). The reason: Sum(If(...)) iterates over every single row and checks the condition for each record, while Set Analysis restricts the data set upfront and then runs the aggregation on a smaller set. For large tables, Set Analysis is significantly more performant and the code is easier to read.
Can I Use Set Analysis Outside of Aggregation Functions?
No. Set Analysis works exclusively inside aggregation functions like Sum(), Count(), Avg(), Min(), Max(), or FirstSortedValue(). Outside of aggregation functions, Set Analysis is not valid and results in a syntax error. The complete list of supported aggregation functions can be found in the Qlik documentation on Set Analysis.
How to master Set Analysis in Qlik Sense?
Set Analysis is what separates dashboards that show filtered totals from dashboards that answer business questions. The syntax is learnable in a day. Getting comfortable with the identifier-modifier combination, and knowing when to use 1 vs $, takes a project or two.
Key takeaways:
- Basic syntax:
Sum({Identifier <Modifier>} Field) - $ is the current selection, 1 is all records
- Operators
=,+=,-=control how values are applied to the data set - Dollar-Sign Expansion makes time comparisons dynamic and flexible
- Performance first: Flag fields in the load script are better than complex runtime sets
- Debugging: Decompose step by step and check Dollar-Sign Expansion separately
Set Analysis is the technical layer. Knowing when to use it comes from working with real business questions — the kind that show up in finance dashboards where controllers expect YTD, prior year, and target comparisons in a single view. If you are still building your Qlik foundation, start with the Qlik Sense Data Modeling Course. Set Analysis will then be the natural next chapter.
What to Read Next
Performance: Set Analysis vs IF() covers when each approach is faster and why it matters for large data models.
Date handling: The master calendar guide shows how to build the date dimension that makes Set Analysis for time comparisons work correctly.
The bigger picture: The finance dashboard guide shows where these expressions fit in a dashboard that actually gets used.