A distributor with €40M in revenue and a DSO of 58 days is financing €6.3M of its customers’ operations. For free. Most of its competitors are doing the same thing, which is why nobody in the room questions it.
DSO benchmarks by industry exist to answer one question: is that number normal, or is it a problem wearing a normal number’s clothes?
This page gives you the benchmark table, the reason DSO varies so wildly between industries, and the part most articles skip. How to tell whether your DSO is your business model or your collections process. One of those is fixed. The other is cash you can still get back.
What Is a Good DSO, Really?
A good DSO is one that sits close to your payment terms. Not close to 30. Close to your terms.
The cleanest way to judge it is the DSO efficiency ratio: actual DSO divided by your contractual terms. A ratio of 1.0 to 1.15 means customers pay on time or close to it. Above 1.5 means late payment is compounding against you every month.
That reframes the usual rules of thumb:
- Net 30 terms: a DSO under 35 is excellent, 35 to 40 is fine, above 45 needs investigation.
- Net 60 terms: a DSO up to 69 is acceptable, above 75 is a problem.
- The widely repeated “45 days or under is healthy” guideline only holds for Net 30 businesses. Apply it to a construction firm and you will panic over a normal number.
If you need the formula and mechanics first, the Days Sales Outstanding page covers how the metric is built before you compare yourself to anyone.
DSO Benchmarks by Industry
The table below blends figures from several 2023 to 2025 working capital studies: the Hackett Group, Allianz Trade, J.P. Morgan, Upflow, and others. The global average DSO across all sectors was 59 days in 2023, so treat that as the centre line.
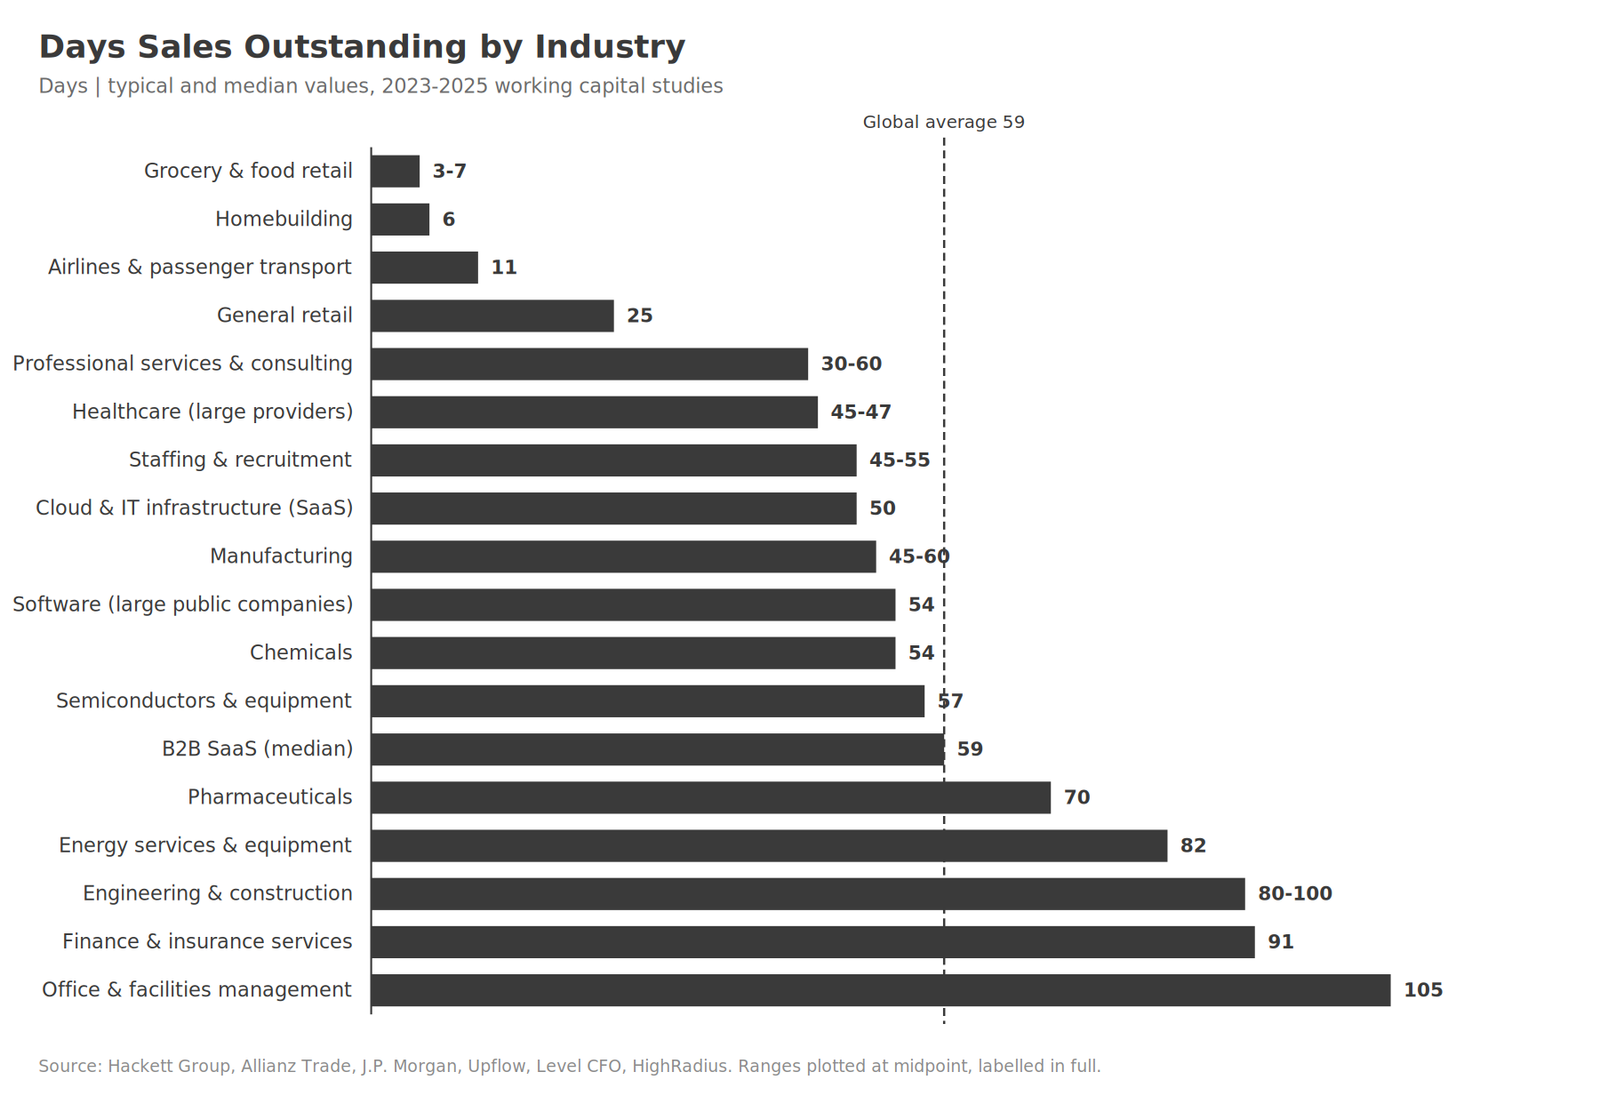
| Industry | Typical DSO (days) | Source |
|---|---|---|
| Grocery & food retail | 3-7 | Upflow 2024 |
| Homebuilding | 6 | Hackett Group |
| Airlines & passenger transport | 11 | Invoiced industry study |
| General retail | 25 | Allianz Trade 2023 |
| Healthcare (large providers) | 45-47 | HighRadius (Fortune 500) |
| Staffing & recruitment | 45-55 | Level CFO 2025 |
| Manufacturing | 45-60 | Industry consensus |
| Cloud & IT infrastructure (SaaS) | 50 | Upflow 2024 |
| Software (large public companies) | 54 | Kaplan Group 2025 |
| Chemicals | 54 | Invoiced industry study |
| Semiconductors & equipment | 57 | Hackett Group 2025 |
| Professional services & consulting | 30-60 | Upflow / Level CFO |
| B2B SaaS (all sizes, median) | 59 | Upflow 2024 |
| Pharmaceuticals | 70 | Hackett Group 2025 |
| Engineering & construction | 80-100 | Hackett Group |
| Energy services & equipment | 82 | Hackett Group |
| Finance & insurance services | 91 | Upflow 2024 |
| Office & facilities management | 105 | Upflow 2024 |
Two honest caveats. These are medians and typical ranges, not your number, and within most industries the top quartile runs 30 to 40 percent below the median. B2B SaaS sits at a 59-day median but the best-run quartile collects in 38. The benchmark tells you where the pack is. It does not tell you where the ceiling is.
Why Does DSO Vary So Much Between Industries?
Because DSO measures how you sell, not how well you collect. Five structural forces set the baseline before a single invoice goes out.
- Cash sale versus credit sale. A grocer takes payment at the till, so there is almost no receivable to age. A manufacturer invoices after delivery on Net 30 or longer and creates a receivable by design.
- B2C versus B2B. Consumers pay instantly. Procurement departments run approval workflows that add latency no contract can remove.
- Invoice complexity. Construction bills in progress milestones and holds 5 to 10 percent as retainage until a project closes. That alone pushes DSO past 80 days with zero collections failure.
- Payer dynamics. Healthcare DSO is inflated by insurance adjudication, not unwillingness to pay. Prior authorizations take 10 to 20 days and a denied claim resets the clock.
- Bargaining power. When large buyers demand Net 60 as a condition of the contract, your DSO rises as a structural feature of who your customers are.
This is why the benchmark matters more than the raw number. Your DSO is only meaningful next to the businesses that sell the way you do.
DSO is also one leg of a longer measure. The cash conversion cycle shows how receivables, inventory, and payables combine into the total time your cash is locked up.
Is Your DSO Telling You the Truth?
Most companies calculate DSO one way and never question it. The standard formula is simple:
DSO = (Accounts Receivable / Credit Sales) x Days in PeriodIt has a flaw. It assumes revenue is spread evenly across the period, so a seasonal business gets a distorted number every quarter. The countback method fixes this by working backward from the current receivables balance through each month of real revenue. The Credit Research Foundation treats countback as the more accurate measure.
The number that actually matters is your Best Possible DSO: what DSO would be if every customer paid exactly on the due date and nothing was overdue.
The gap between your actual DSO and your Best Possible DSO is the part worth money. Call it the unapproved loan. It is the slice of your receivables that exists only because invoices are late, not because your terms created them. A healthy operation runs within 15 percent of its Best Possible DSO. Most have never measured the gap at all.
What Is High DSO Actually Costing You?
Take a €40M distributor on Net 30 terms with a 58-day DSO. The 30 days it is owed by contract is just the cost of doing business, roughly €3.3M in receivables. The other 28 days is the problem.
That is €3.1M the company has lent its customers with no credit agreement, no interest rate, and no decision to do it. At a 7 percent cost of capital, carrying that unapproved loan costs about €217K a year in interest the business never sees as a line item.
It is not a small or isolated problem:
- The Hackett Group found €1.7 trillion in excess working capital across 1,000 large US companies, with $600 billion sitting in receivables alone.
- J.P. Morgan put $707 billion of trapped working capital across the S&P 1500 in 2024, with 67 percent of those companies reporting a longer DSO than the year before.
- Atradius found 55 percent of US B2B invoiced sales were overdue in its 2024 survey.
High DSO does not show up as a loss. It shows up as a number that looks normal next to a benchmark, which is exactly why it survives for years.
You can run your own version of the distributor math with the DSO calculator before you go looking for the gap.
Is DSO Rising or Falling in 2026?
Rising, and it has been since 2022. Global DSO jumped three days to 59 in 2023, the steepest single-year increase since the 2008 financial crisis, according to Allianz Trade’s survey of around 45,000 listed companies.
2024 was mixed. The Hackett Group found receivables performance worsened for a second straight year, even as semiconductors saw DSO surge 17 percent in a single year. Europe and North America split: EU DSO crept up under revenue pressure while North America improved slightly.
The driver is consistent across every study. Large buyers are extending payment terms on purpose, as their own working capital strategy, at their suppliers’ expense. If your customers are bigger than you, expect upward pressure on DSO regardless of how well your collections team performs.
Where DSO Hides Money You Can Still Get Back
A single DSO figure is an average, and averages hide the distribution. An aggregate DSO of 58 can be 30 customers paying in 35 days and 5 customers paying in 130.
Your ERP will not show you this cleanly. The built-in AR aging report gives you buckets, current versus 30, 60, 90 days past due, but not DSO by customer, by segment, or as a trend against Best Possible DSO. The money hides in three places:
- The customer tail. A handful of slow payers can drag the whole average. They are invisible until you rank DSO per customer.
- The segment mix. One business unit or region can run 40 days worse than the rest and never surface in the consolidated number.
- The drift. DSO creeping up two days a quarter is unremarkable month to month and a serious cash problem across two years.
The benchmark table tells you whether to look. Your own data tells you where. If the consolidated number looks fine but finance keeps chasing cash, that gap is the subject of the DSO dashboard gap.
The Bottom Line on DSO Benchmarks
DSO benchmarks by industry are useful for exactly one thing: telling you whether your number is your business model or your collections process. A construction firm at 90 days and a SaaS company at 90 days are not the same story, and neither is automatically a problem.
The benchmark is where the question starts, not where it ends. The answer is the gap between your DSO and your Best Possible DSO, measured in your own ledger, customer by customer.
Where to go next:
- If you want DSO as a live operating view instead of a month-end number, the finance dashboard guide covers the architecture for tracking it continuously.
- If your reporting shows DSO but not the cash trapped behind it, the DSO dashboard gap explains why the metric and the money keep disagreeing.
- If you want the unapproved loan quantified in your own data, customer by customer, the Hidden Money Audit runs that gap analysis and ends with a recoverable figure.